|
JOURNAL (III)
go
to journal (I)
go to journal
(II) last update
2008/11/29
|
most important
links
|
|
Main Mission links:
|
|
Important notes about mission
times and balloons:
- Meanwhile there is some confusion about timing
terminology and references. In the course of this page we started using the
term "Mission Elapsed Time" (MET) as the LUXPAK system-time. Then
Brian Davis computed the LUXPAK elevation data against MET in the Excel-file
LUXPAK-BD.xls,
where he identified MET with the start of Balloon#1. Now Eric Wang proposes
a new document GPS summary.xls
with MET* = 0.0 corresponds to 6:52:43 PST, the moment of launch of
Balloon#2. (We denote MET* - MET_star - as Eric's mission time)
- If we are talking about MET on this page,
we will refer to the start of Balloon#1 as Brian suggests: MET
= MET* - 48,8667 [min]
- Since LUXPAK was switched on 157 seconds
before the launch of the balloon, we define:
LUXPAK_time = MET + 2,61667 [min]
- In the announcements of the HALE project,
Balloon#1 was supposed to transport LUXPAK. However this balloon was
launched about 49 minutes after Balloon#2. Now in the recent official
web-pages after flight, names have been inverted. Since the LUXPAK journal
(III) was started early after the mission, we kept on using the old names.
So, in the course of this page
- Balloon#1 =
"ENERGIZER"-Balloon = Balloon#2* , carrying
LUXPAK (the star indicating the new official name)
- Balloon#2 =
"NXT"-Balloon = Balloon#1*
|
|
2008/07/29
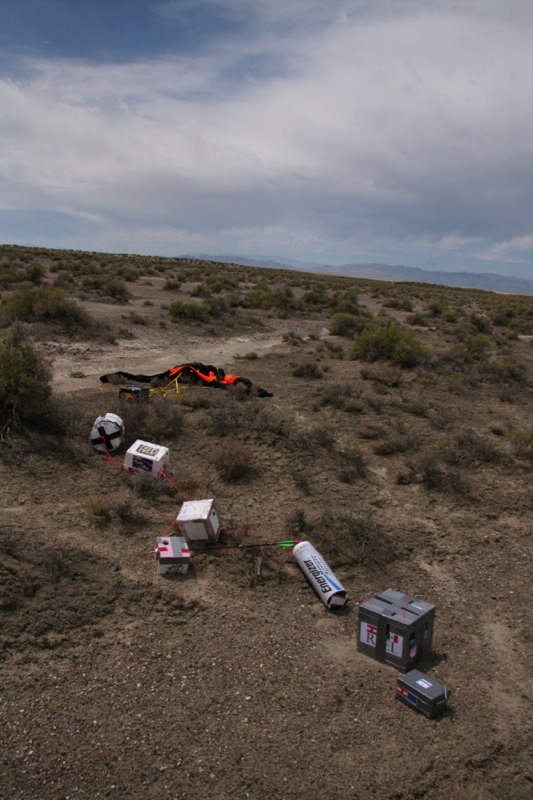
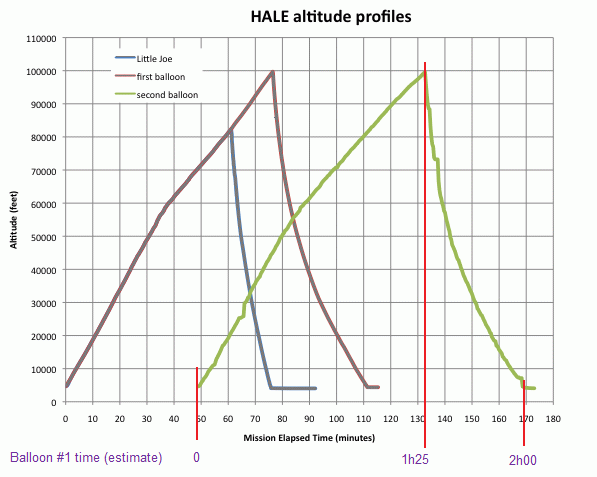
- The H.A.L.E. mission succeeded !!! Balloon #1
and #2 lifted to 99560 ft and 99730 ft respectively. They landed more
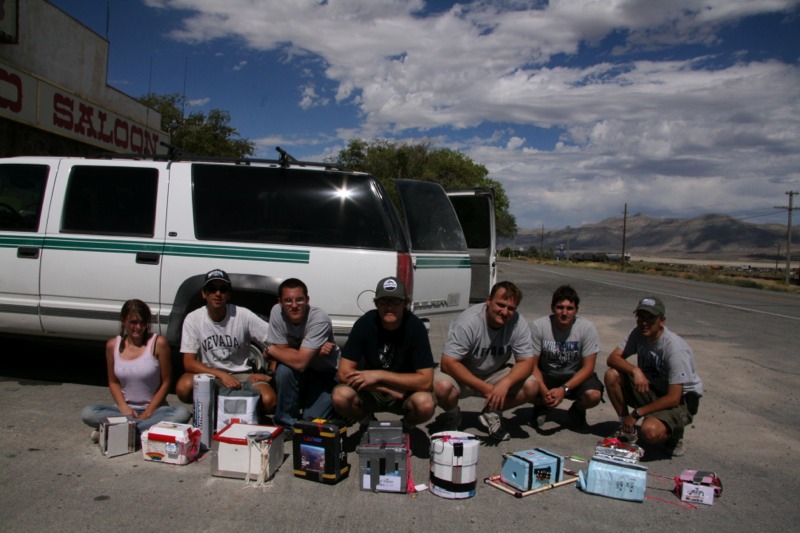
or less safely after about 2 hours flight. The ground team recovered the
payloads except one - the LEGO Mindstorms team's top secret payload is
missing. Otherwise : Congrates to the ground team !!!
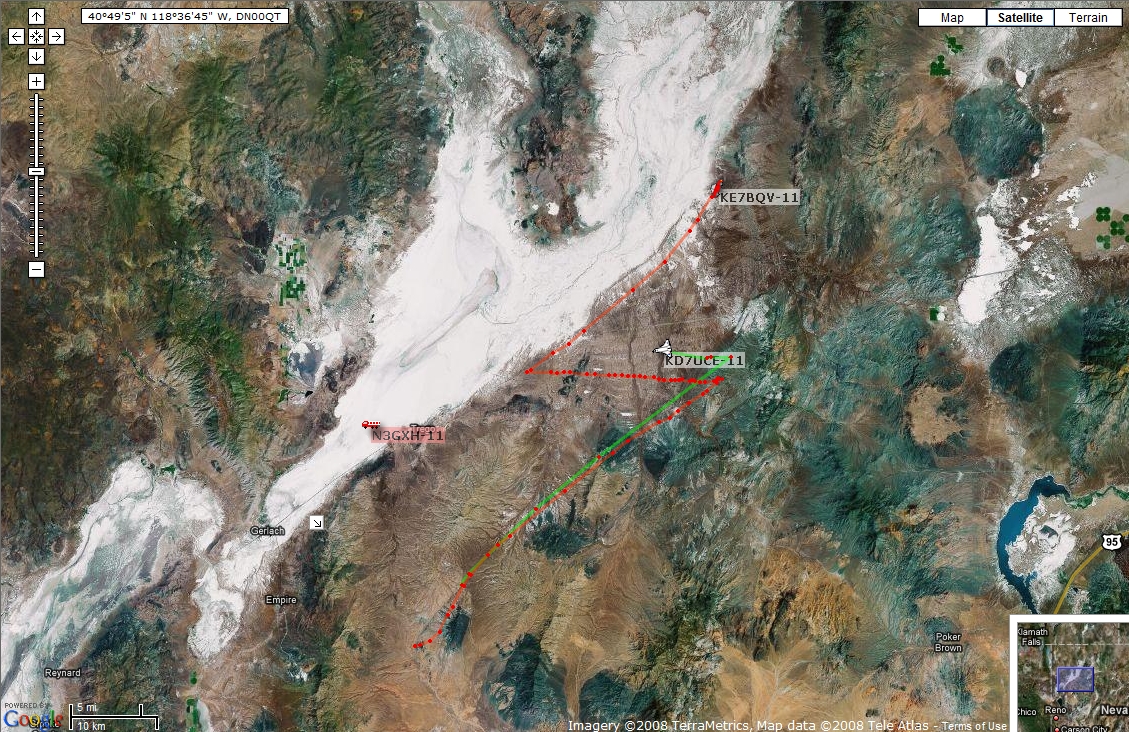
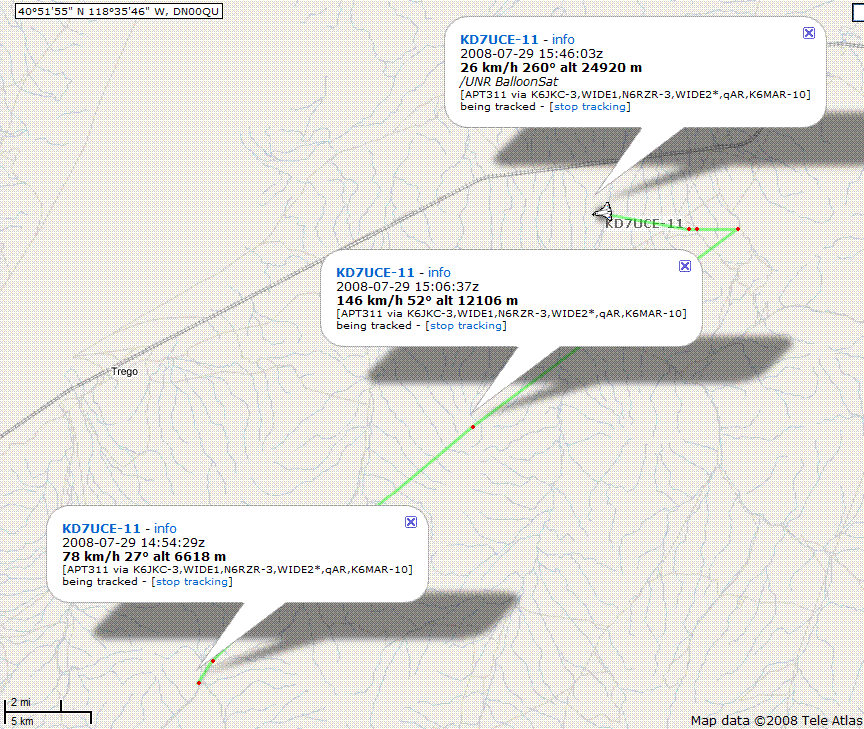
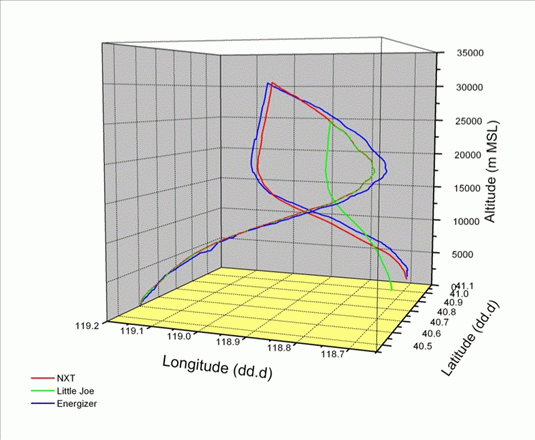
- Here a couple of screen-shots of the HAM
tracking. (Open the picture in a separate window to see the details). The
red line shows the path of Balloon #2 and the green the one of Balloon # 1
carrying LUXPAK. The payloads were found back by additional GPS tracking
systems.
|
|
|
2008/07/30
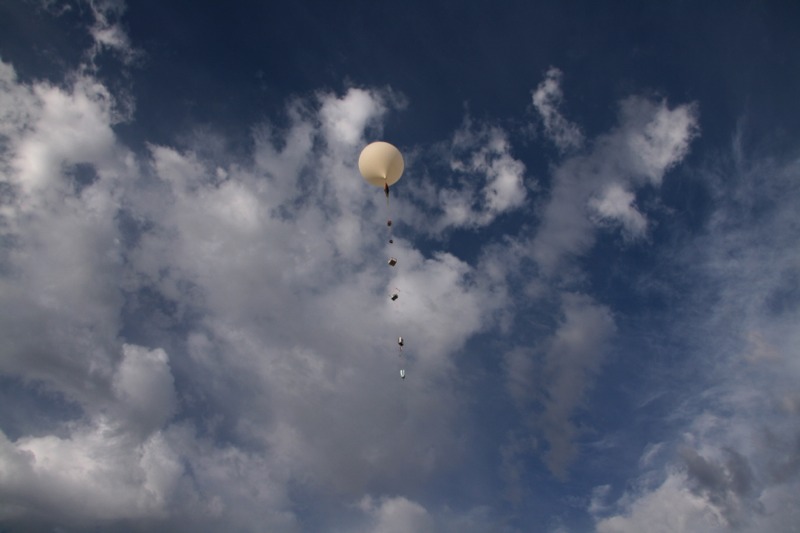
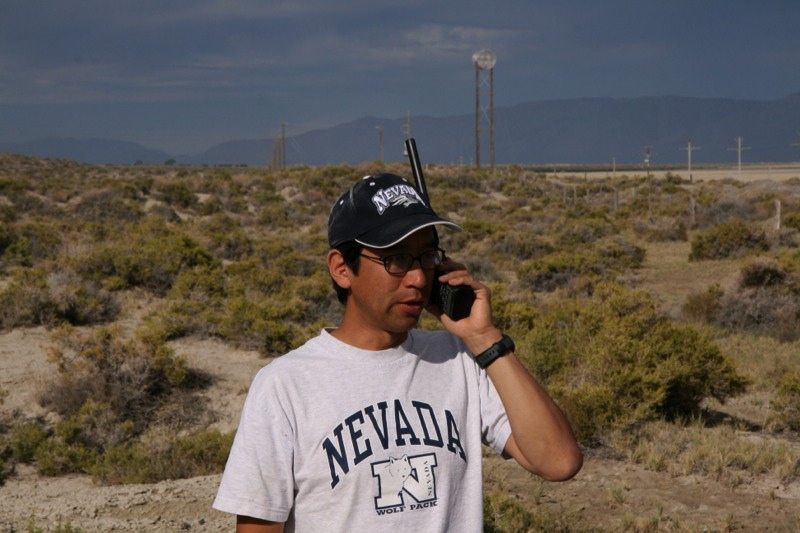
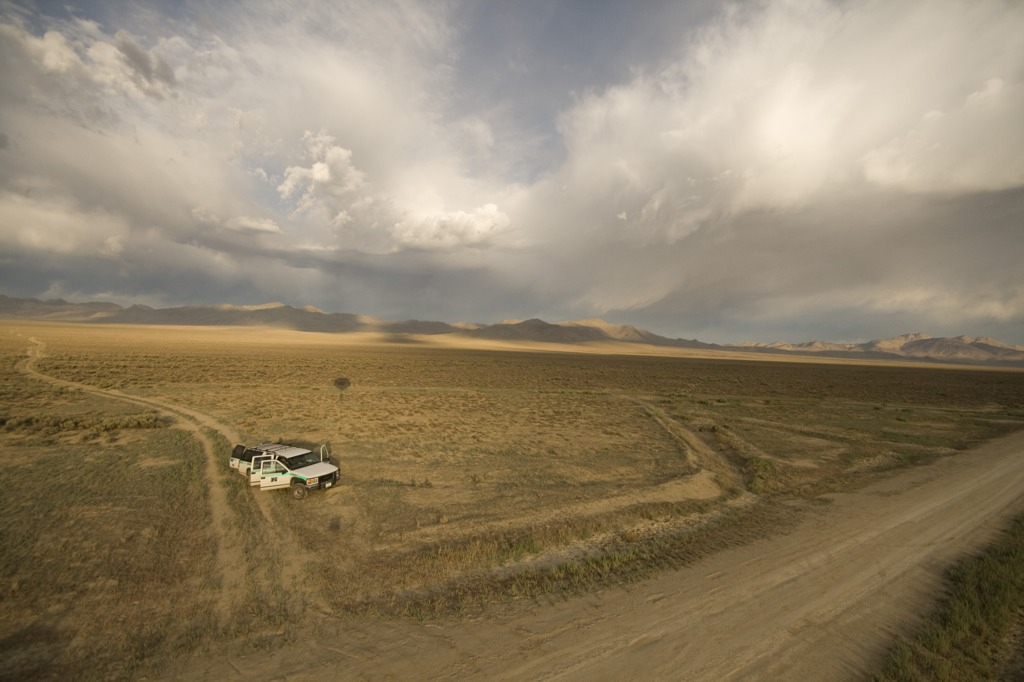


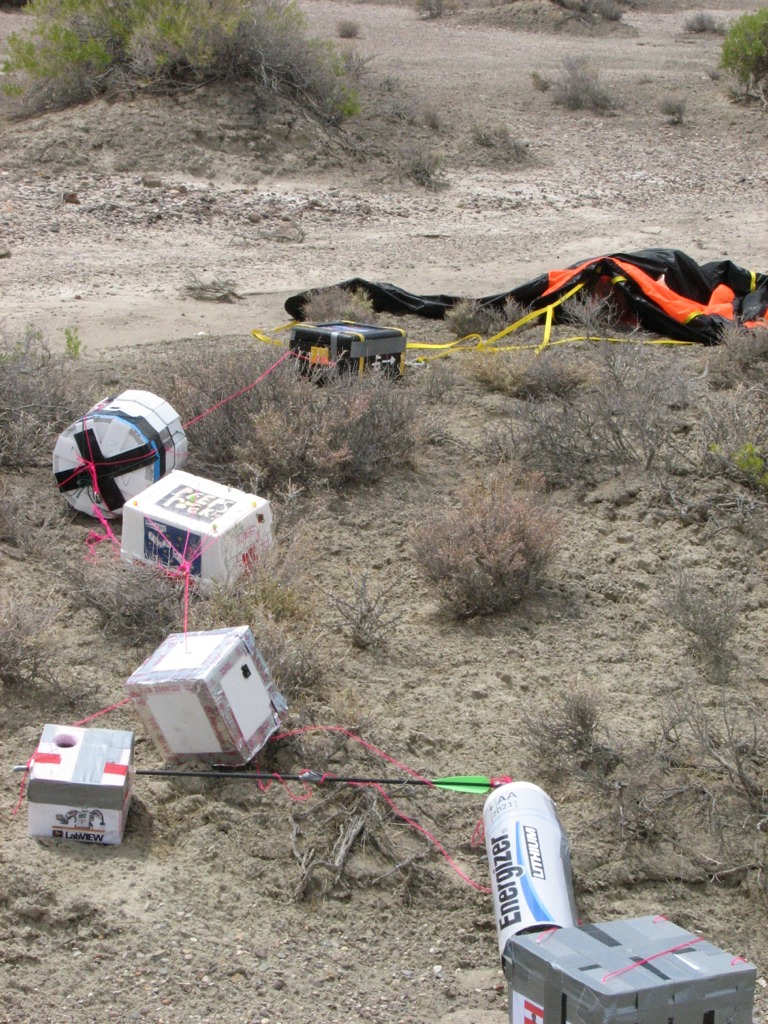
Add-ons 08/08/11
:
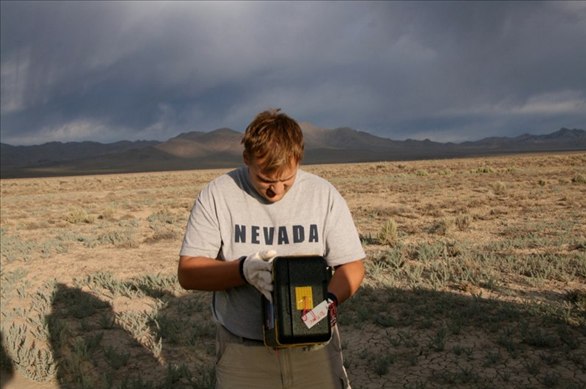
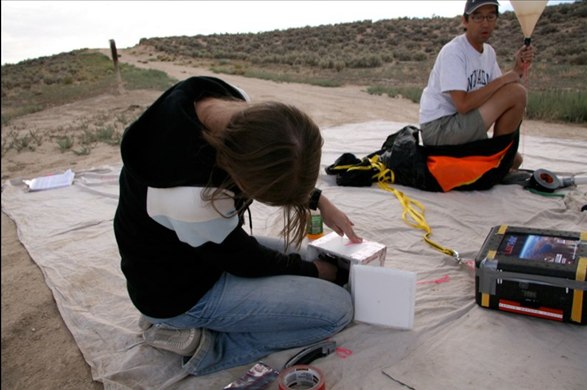

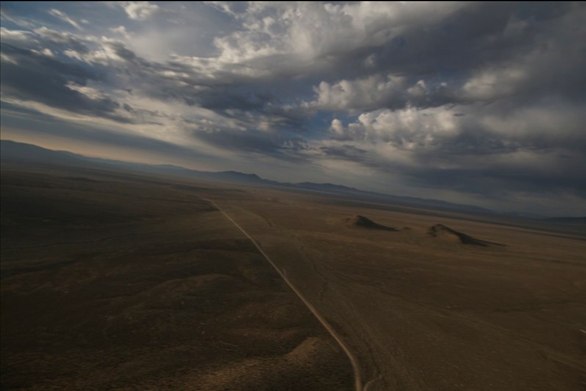
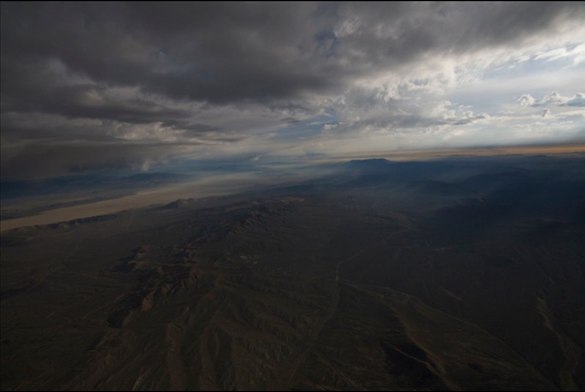
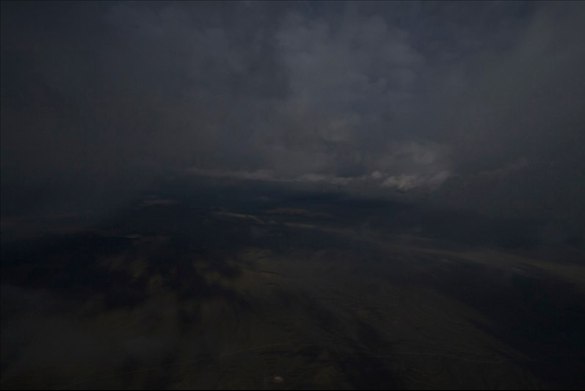


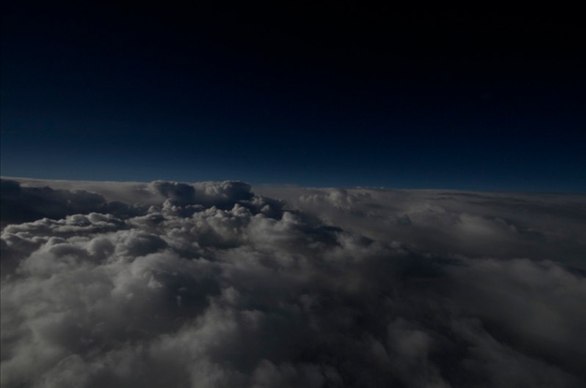
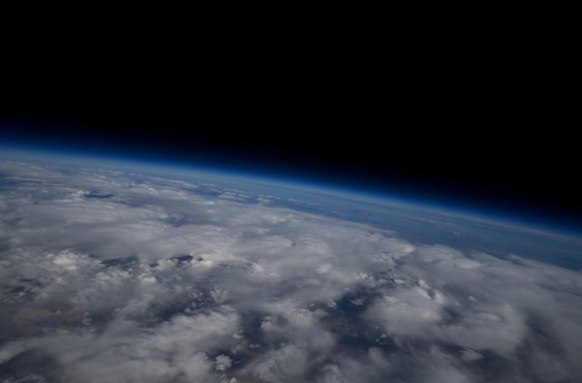
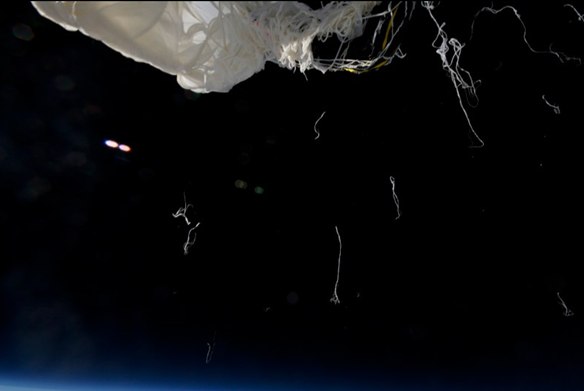
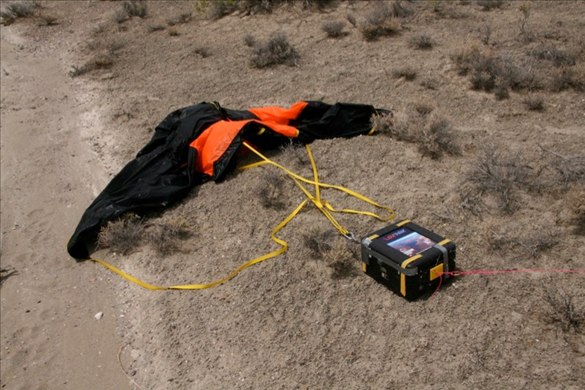
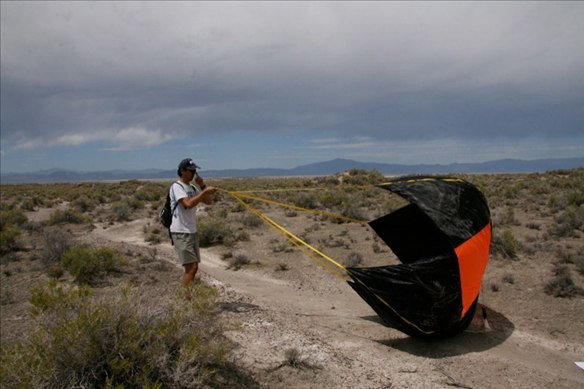
|
 |
Eric's
album |
 |
Eric's
quick report shortly after flight and recovery:
We just rolled into
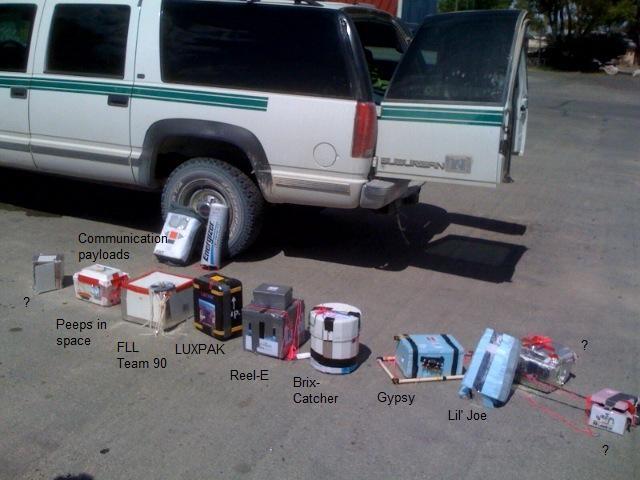
Reno. I posted two photos on our way in as we
regained cell phone coverage. As you can see "almost" all
the payloads
made it back just fine. We did manage to loose the LEGO Mindstorms
Team's payload somehow (photos to come).
It was a VERY long day
for us - up at 5:00AM and back to Reno at
6:30PM. Here's a quick recap:
Balloon #2 (which was
actually the first to be launched so that we had
more time to pick-up little Joe):
The recovery was a hard-long hike up a some pretty bad terrain.
Luckily the cloud cover kept the temperature in the low 90's for us
(it actually started to rain while we were launching balloon #1).
SLR payload: worked
fine, although my NXT batteries died (serves me
right for trying to use them for 3 missions). It looks as though it
lasted the entire mission and died while on the ground because we have
over 1800 photos (300 of them of the landing site). I'll know more
when I download the datalogged data tomorrow.
FLL Team 90: seems to
have worked like a charm. Upon start up, the
pinwheel spun around as expected. The NXT was still running when we
recovered the payload. Like most of the payloads, it was covered with
shards of the balloon (David was wondering what that was in the
photo). If you want us to download the data and email it, let me know
and we'll take care of it tomorrow.
Gypsy: started up fine
and seems to have worked. The NXT was locked up
when we recovered it, but the onscreen message indicates that it was
in a part of the program that is active during descent (according to
Brian - who gets a big THANKS from our entire team for serving as the
go-to contact during the mission). I have not extracted the camera
from the payload but it did turn on at launch.
NXT communications:
worked fine, but we couldn't hear it for too long
as we weren't chasing it directly because we were busy getting the
next balloon ready and launched. It suffered a bent radio antenna
(bottommost payload always hits the hardest) but otherwise was still
functioning when we recovered it (still sending GPS locations).
Little Joe: We released
little Joe around 82000 feet. The SPOT worked
and led us directly to it (first hike of the day). The parachute
deployed but got entangled by the tail-fin string. The parachute must
have worked somewhat because both the SPOT and NXT were still
functioning after falling around 78000 feet. We tried to download the
GPS data but had problems connecting to the computer we brought along.
Jeff will try to download the data tonight or tomorrow. Irregardless,
Brian now holds the world record for longest NXT freefall (80 seconds
- at least).
Balloon #1 (second
balloon launched):
Compared to the other launch, this was easy to recover - a 1/2 mile
hike across fairly even terrain. It was HOT though as the sun decided
to come out and we were hiking near noon.
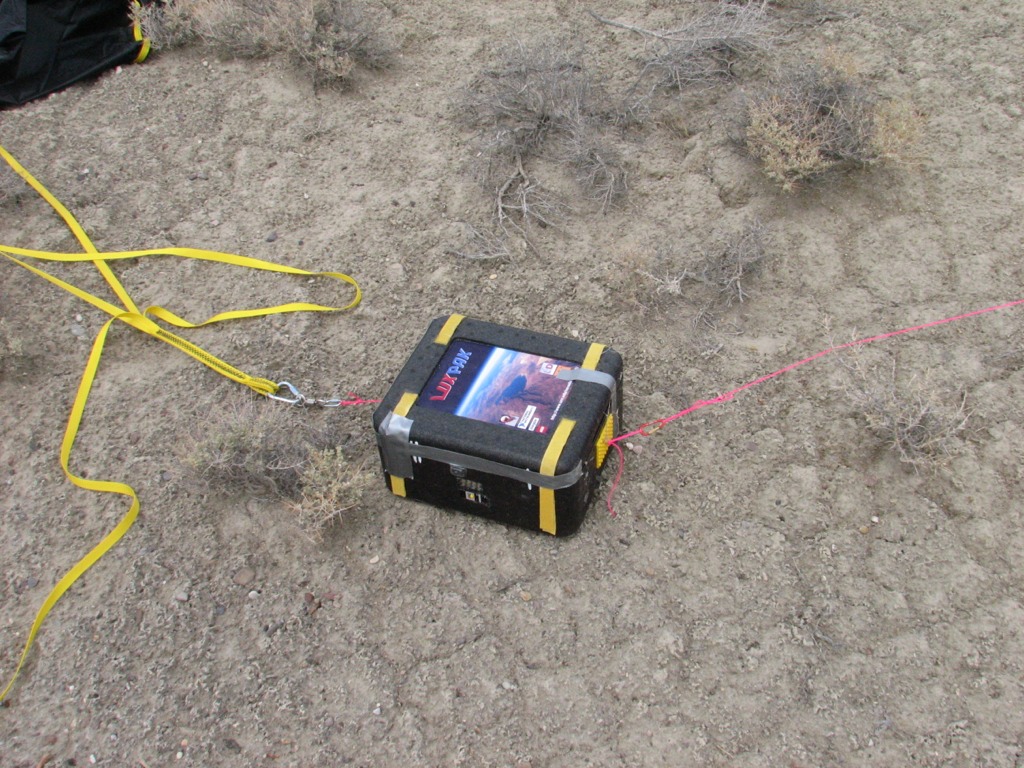
LUXPAK: booted up and
the LED's showed everything normal. Recovered it
with absolutely no damage. We have not attempted to extract the data
as that seemed pretty complicated. We may attempt it tomorrow, but
we're a bit to tired now and are afraid of making a mistake and
loosing the data.
Brix Catcher: We are
not sure if it worked as it does not give any
visual or audible confirmation when started up. The flaps were all
closed at recovery and the payload did not suffer any damage. We have
not opened the payload to inspect the NXT. If you would like us to do
something with the NXT or video camera, let us know.
Peeps-in-Space: Seemed
to work fine. It made it's noise when we
started it up. The peep inside doesn't appear to have suffered any
damage (we were expecting the inside of the payload to be all covered
with yellow bits of marshmallow). The NXT was still running when we
opened the payload (we turned it off). Again, if you want the data
emailed, just let me know).
UNR student payload:
not related to HALE, but her payload worked fine.
Took pictures using a point-and-shoot digital camera and logged
temperature (internal and external) and pressure. We'll get the data
posted later this week.
NI video camera
payload: in our rush to launch, we must have mis-
aligned the camera and we ended up getting and hour of video of open
sky. Not bad, but we wanted to film the balloon not sky. A video of a
bursting balloon eluded us once again...
REEL-E: the payload
seemed to work fine. We were a little perplexed by
some initial motion when we started it up. The instructions weren't
clear about what was supposed to happen so we are not sure if it
functioned as planned. It did survive the flight intact but we have
not opened it up yet.
Overall a great
mission. Both balloons reached nearly 100,000 feet and
the payloads performed wonderfully. All the teams should be VERY proud
of their work. Your hard work and creativity has paid off. You are all
part of a very elite group now!
Got to get home to the
family now. I'll try to post some photos after
dinner.
Eric
|
|
2008/08/01
-
Yesterday evening Eric sent us
the data file. There were some troubles during the upload from LUXPAK to the
LabVIEW S_L_VIEWER.vi program. Since the upload process requires human
manipulation on the PC and the RCX, some synchronization issues appeared
that rapidly were solved. Finally Eric was able to extract all the data.
Thanks !
-
We now will go through the data
and comment them:
|
|
|
1.
Balloon altitudes
-
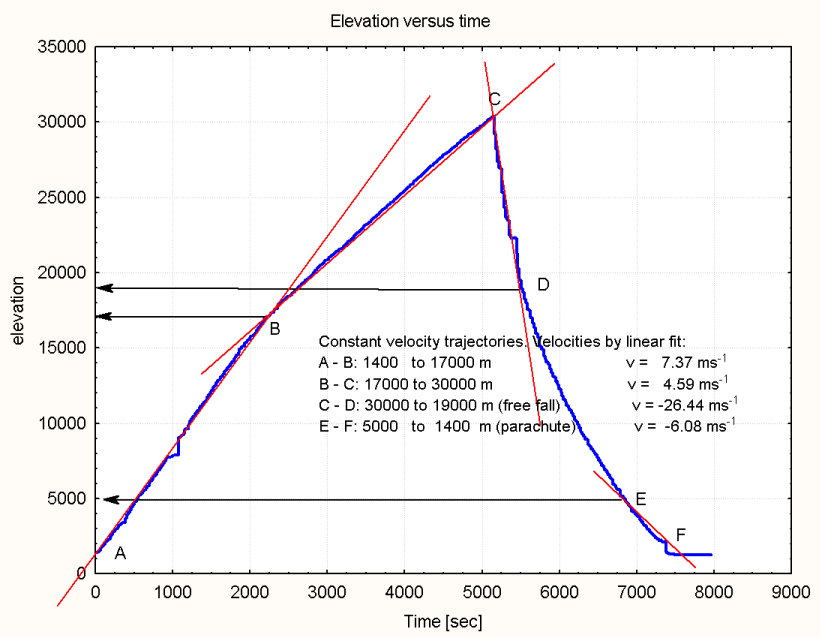
The second balloon was in fact
"Balloon #1" that carried LUXPAK.
-
From UNR we took the altitude
graph in order to have a timing reference.
-
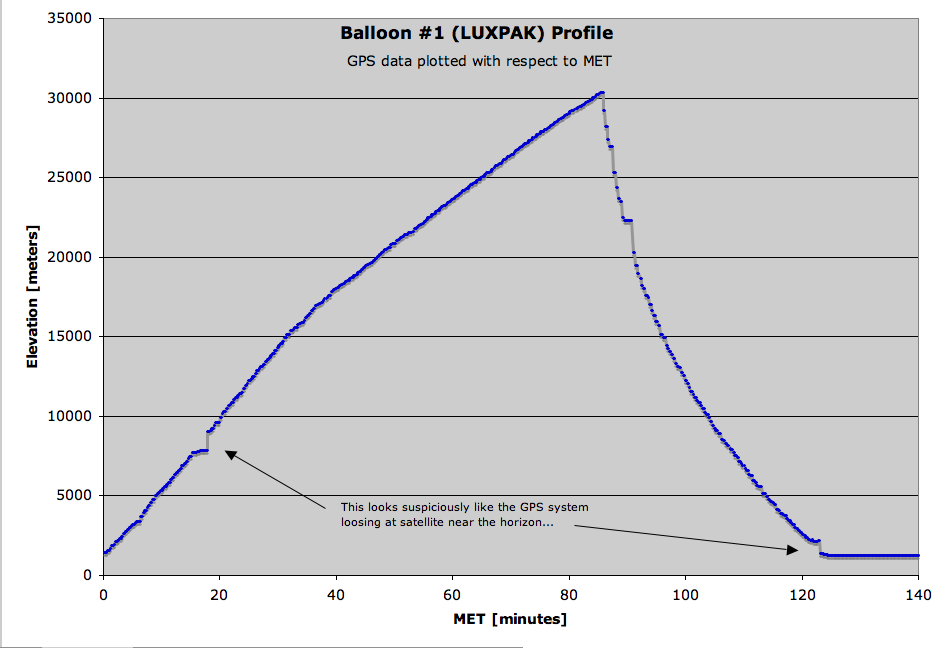
Brian Davis plotted the data in
a better way: (thanks Brian)
Add-ons 08/08/07
:
Add-ons 08/08/08
:
-
We changed Brian Davis' table,
where he relates the LUXPAK elevation to MET. In fact, LUXPAK has been
switched on 157 seconds before MET. this has to be respected. Here the new
relation: LUXPAK_time_elevation_CB.xls.
This is important while comparing the atmospheric pressure data to the
height for example.
Add-ons 08/08/11
:
|
|
|
2.
Atmospheric
pressure
-
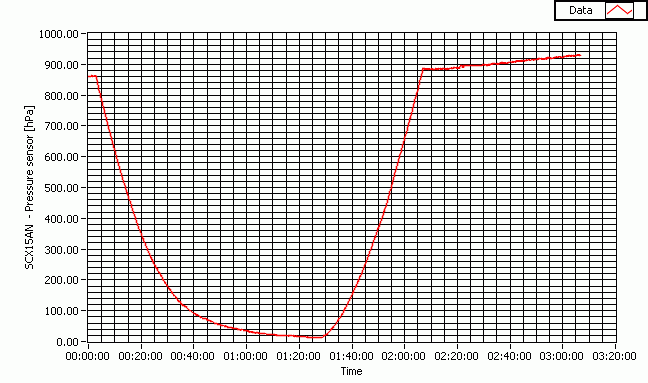
The UNR ground team was very
careful with LUXPAK. Thanks ! They didn't close the styrofoam box in an
air-proof way, which would have corrupted the pressure mesaurements.
-
It now would be interesting to
have a comparable pressure profile. Brian, could you share yours in
excel-format?
-
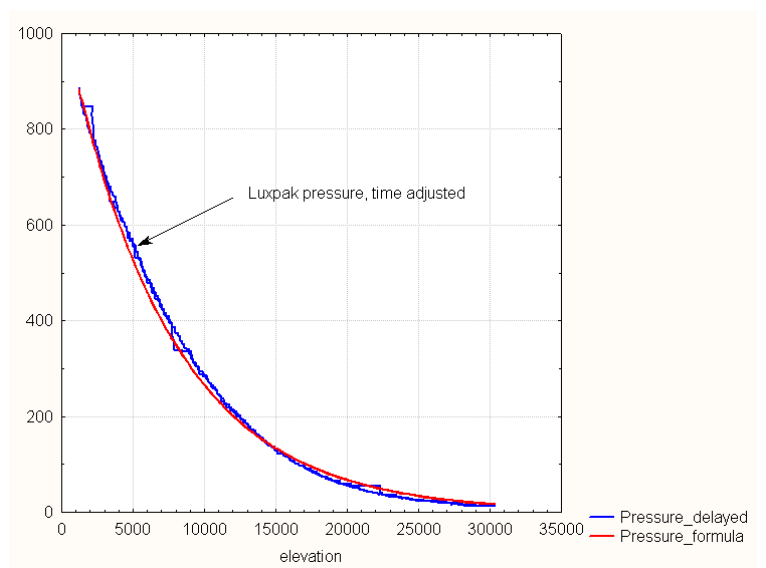
It seems that there is a certain
drift, that is difficult to explain. Might be that the pressurization
between the exterior and the interior has a very high time constant:
compared to the altimeter measures there is a delay of about 5-10 minutes
between the extrema.
-
The minimum value is 12hPa.
Brian indicates 14hPa.
Add-ons 08/08/03
:
-
Brian Davis measures 882hPa at
start of Balloon#2, which was launched about 1 hour before Balloon#1. LUXPAK
measured 861hPa. Eric reported that it started raining, when Balloon#1 was
launched. This might explain the difference.
-
The final drift probably depends
on the temperature increase of the container atmosphere.
-
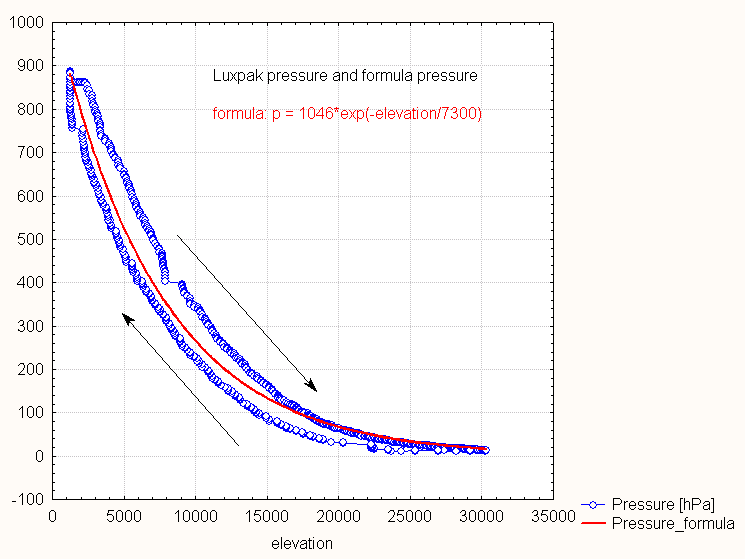
Altitude at start was 1428m. The
landing ground was 1232m above main sea level. From the formula
exposed at http://www.atmosphere.mpg.de/enid/1442
we can calculate that the pressure at landing altitude 880hPa -assumed the
atmosphere was constant. LUXPAK measured 882hPa.
Add-ons 08/08/06
:
Add-ons 08/08/08
:
Add-ons 08/08/09
:

|
|
|
3.
Ozone
concentration
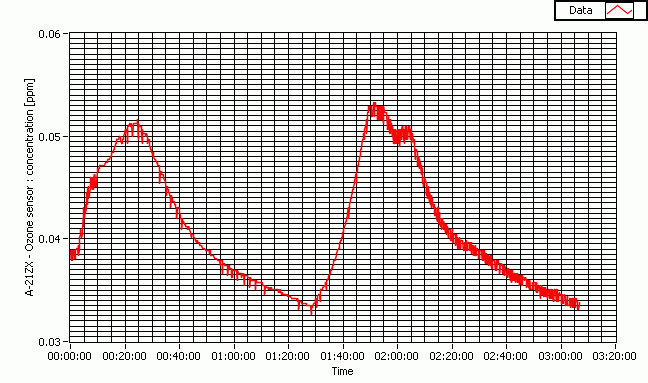
leaves us puzzled ????
-
The ozone-concentration peaks at
Mission Elapsed Time (MET) 25' and 1h50' correspond to the altitude 40000ft
= 12km, reached during ascension and 5km at descension. Interestingly Fig. 5 of
the document
on the sensor-equipment and the calibrations shows this
troposhperic peak. But the stratospheric most significative peak is totally
missing at altitudes 20-30km. This is intriguing. Francis, I've no cue. Ah,
I noticed that we have a maximum of balloon speed over ground -equivalent to
the wind velocity- at 12km altitude.
-
The slow recovery after the
mission perhaps is related to the temperature of the air that arrived at the
sensor nose. In fact there has been a big issue with the heater that we will
analyse now.
Add-ons 08/08/03
:
-
I wonder, if we must not take
into account the air density. Francis, perhaps we must contact the sensor
producer to hear more about how the sensor actually measures the
concentration, and what formula they internally apply.
-
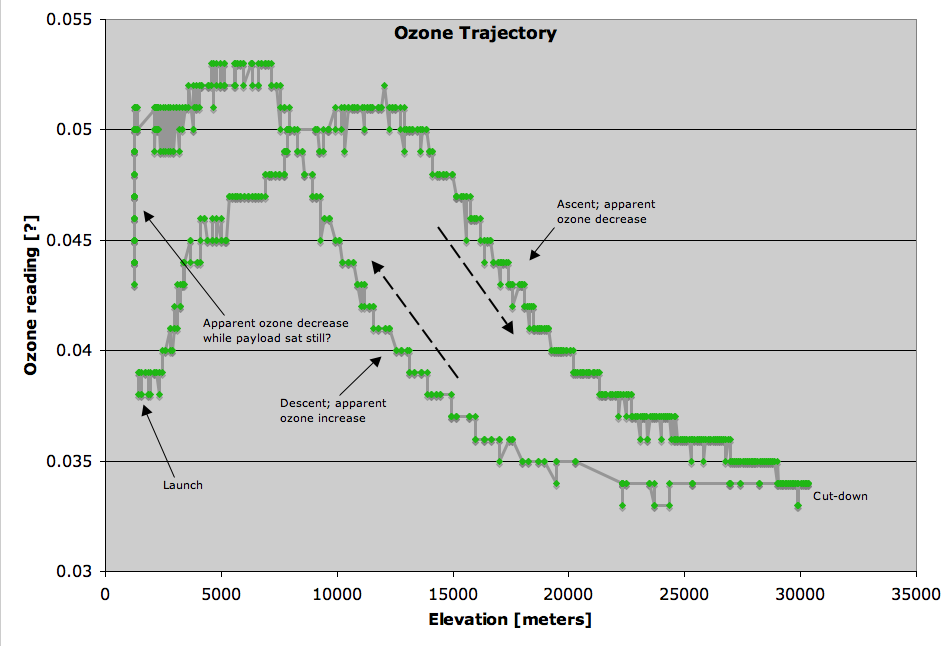
Brian plotted the data against
elevation: (thanks Brian)
Add-ons 08/08/04
:
|
A few links to to stratosphere ozone
measurments: (not sure how useful they are)
|
|
4.
PWM_heater
-
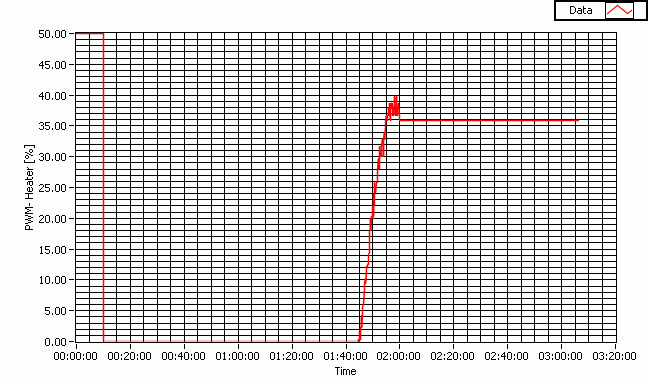
The heater switched on at 50%
duty cycle during the first 10 minutes as programmed.
-
Because the air temperature
inside of the ozone-sensor case never dropped below 10.5°C, the tube heater
was not switched on. At Mission Elapsed Time (MET) 1h45' however, the
battery-temperature dropped below 25°C, switching on the heater at variable
power according to the function described in Fig. 11 of
LUXPAK_control.pdf.
-
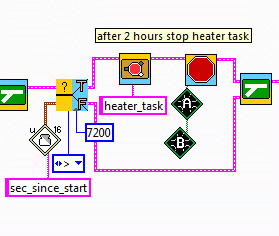
After 2 hours, the heater should
have switched off. But due to a bad bug in the RCX firmware, the heater task
was stopped BEFORE switching off the RCX outputs. So, the heater was no
longer controlled and continued powering during 1 hour, before the ground
team switched LUXPAK off. In the program-part below, which is executed in
the heater_task itself, the task is stopped, so it cannot reach the stopping
of the outputs anymore. The reason for this bug is:
-
we had moved this code from
another task to the heater task, without thinking about the issue that,
if a task stops itself, the following code isn't executed anymore.
-
the final firmware never was
tested over that time.
-
hmm. We need to learn the
lesson that any firmware change requires new tests.
-
This bug could have led to fatal
troubles, because no other task controlled the heater. Fortunately the PWM
value was 36% only. And there also were the hardware fuses that would have
cut the current.
Add-ons 08/08/04
:
-
The explanation why this bug is
in the firmware is a whole story. (Everything has a cause !) The small code
portion above in fact was part of another task that was supposed to react on
time. The idea was, that once the system time passed 2 hours, that
particular task should first stop the heater task in order to prevent it
from restarting the heaters because of sensor triggering. Then the timing
task should switch off the heaters. But, when finishing the firmware, we
moved the code portion into the heater task, because we wanted to gather
everything concerning the heaters in one task. We totally forgot that this
code move required that the heaters should first be stopped and then the
task.... So, once again, it must be said: "Never change a running
system!"
|
|
|
5.
Battery
temperature
-
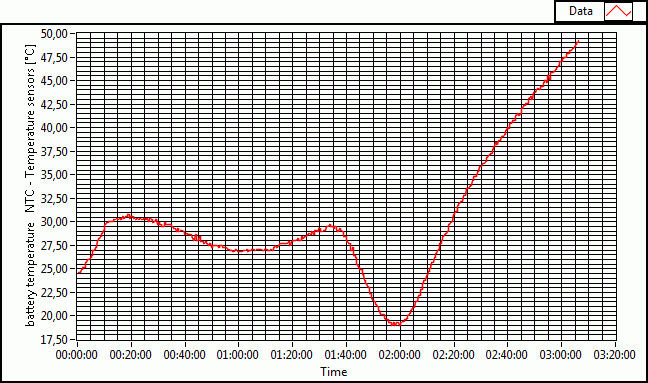
The battery temperature rises
during the first heater time. During the ascension the temperature at the
battery pack doesn't change very much. But during the descension,
temperature drops rapidly below 25°C, triggering the heater. As explained,
the heater sould have shut down after 2 hours. But, it didn't. Thus, the
battery temperature increases, while LUXPAK is waiting for the ground team.
|
|
|
6.
RCX
temperature
|
|
|
7.
ozone
sensor temperature
Add-ons 08/08/04
:
|
|
|
8.
tube
temperature
-
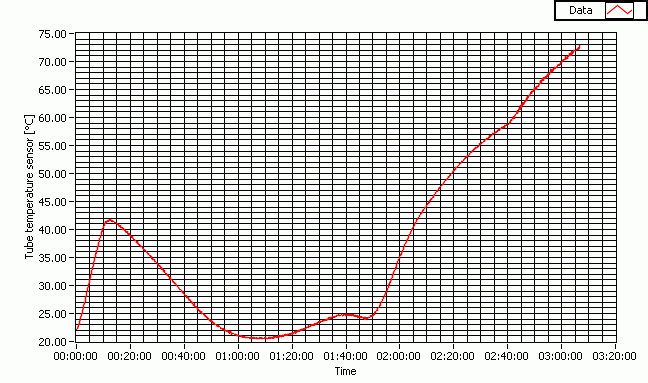
The tube temperature obviously
rapidly increases during the first 10 minutes, then slowly drops.
Interestingly, it stabilizes around 23°C until the final phase, where the
heater is activated and, due to the firmware bug, is not stopped.
|
|
|
9.
air
temperature
leaves us puzzled ????
-
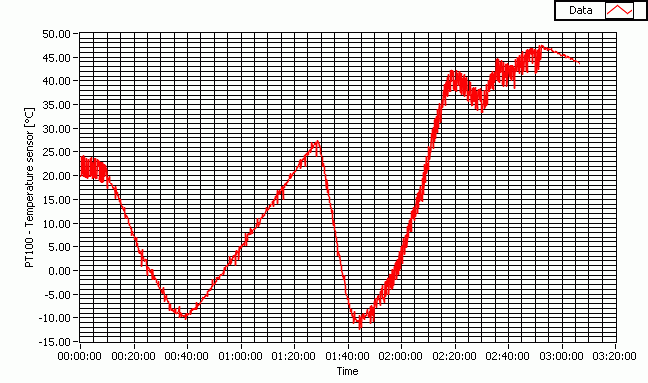
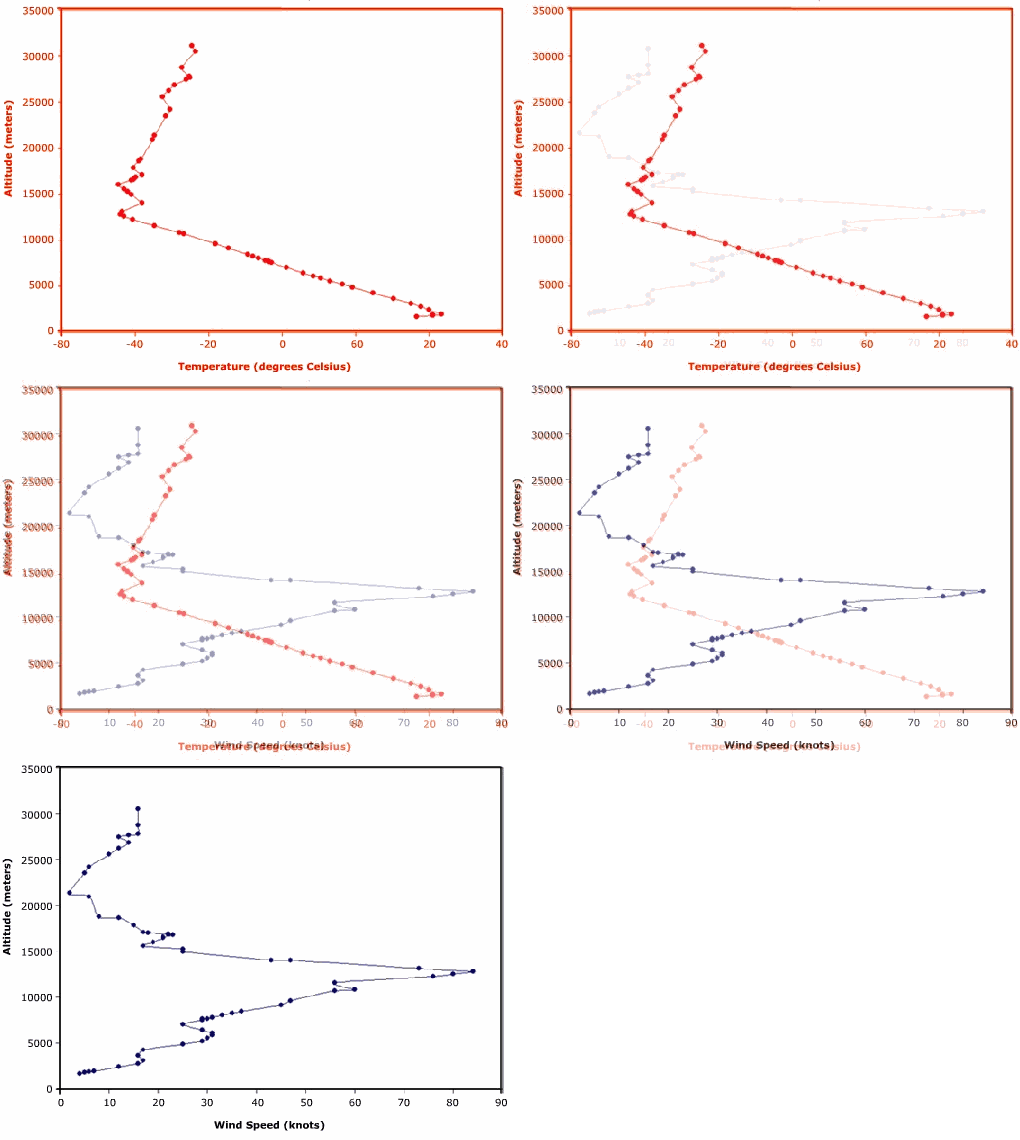
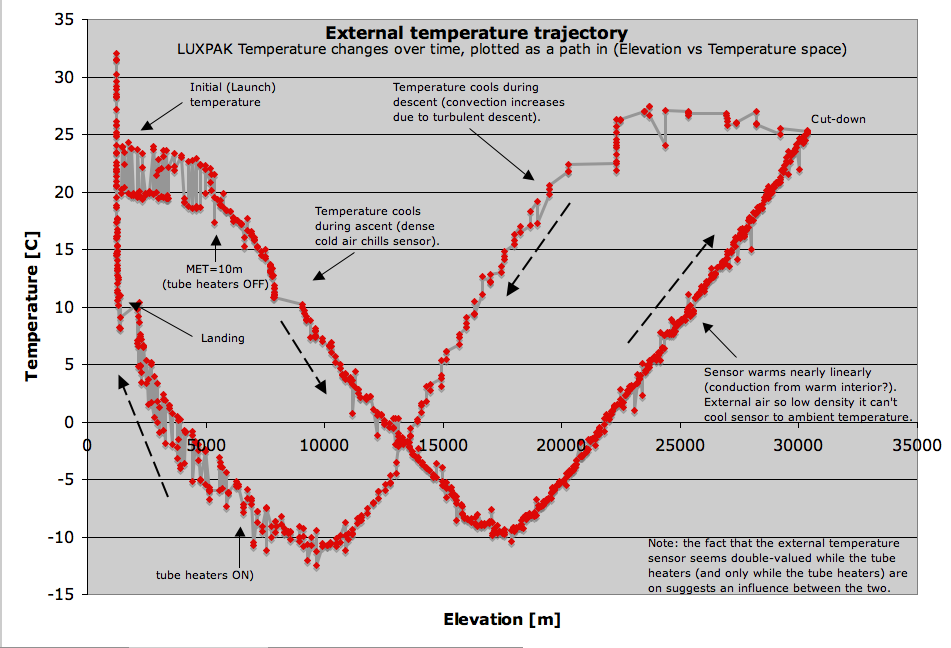
The interesting air temperature
profile is not what we expected. It is minimal at MET 40' and 1h45', during
ascension corresponding with the altitude 60000ft ~= 18km. (Because the
descension is so much faster than the ascension, the sensor may perhaps
react with a certain delay due to its own thermic inertia.However there is a
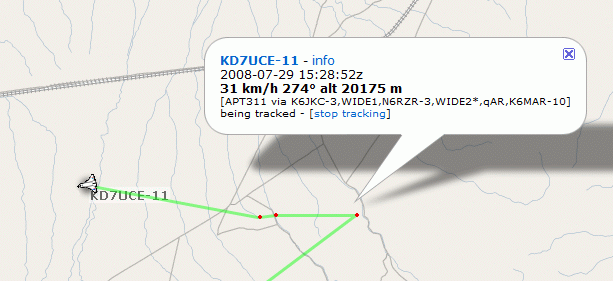
clear temperature inversion starting from 18km altitude. The stratospheric
inversion also is visible on the path that the balloon took. In fact it
zigzagged at the indicated altitude. The speed over ground was very low
compared to the speed at lower altitudes (see above):
Add-ons 08/08/02
:
-
The absolute values of the PT100
values may be a bit too high. Perhaps one reason is that most of the
sensor's 2cm metallic collector sticks in the styrofoam container wall. (See
Fig. 1 of
the document
on the sensor-equipment and the calibrations) Only 3-4mm are in
direct contact with the outer atmosphere. Probably the outside temperature
is 5-15° colder than indicated on the graph. Francis, we have to model out,
what we actually measured in the isolation material.
Add-ons
08/08/03
:
-
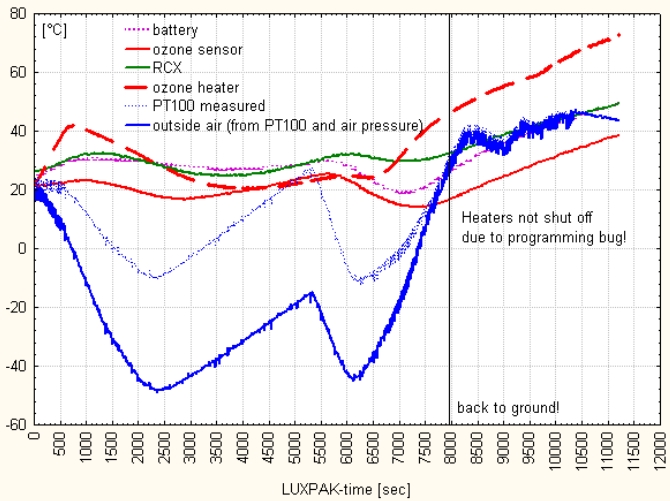
Important observations:
-
The tube-heaters were off
during most of the flight. They operated only during the first and the
last 10 minutes. The final heating was due to the firmware bug as
explained.
-
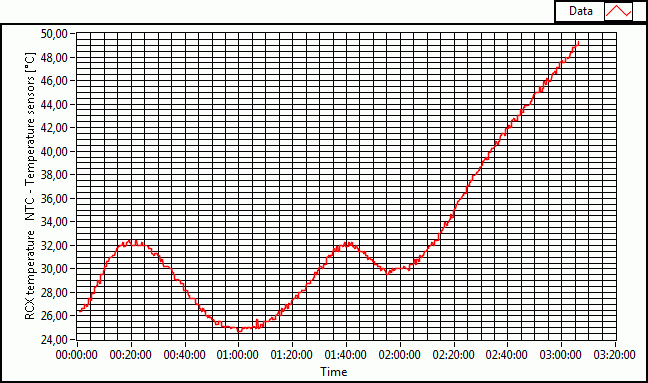
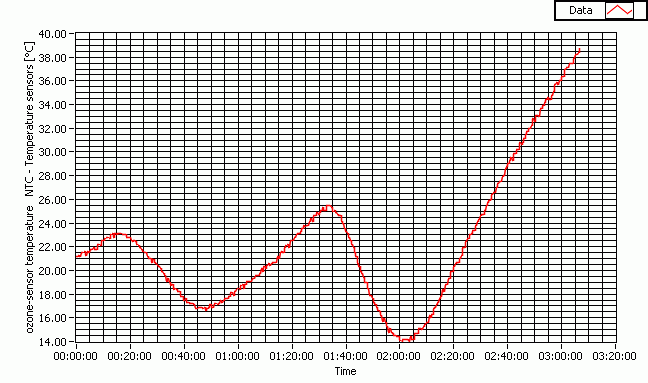
The inner temperatures first
rise then fall to a minimum, then rise again. But the second hump
FOLLOWS the one shown by the PT100 graph. Thus, no interior temperature
rise may be the cause of the PT100 rise.
-
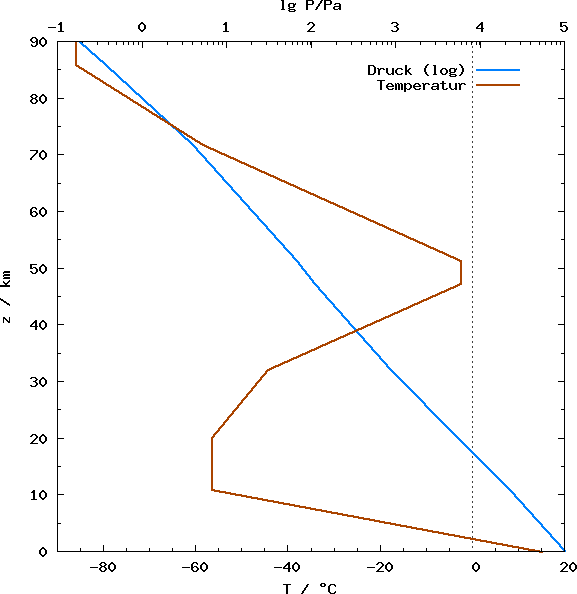
If we have a look at one of
the 1976 standard atmosphere graph, we can observe the temperature
inversion in the stratosphere (...OK, I took it from wikipedia,
referred from the German page about the
standard atmosphere... Francis, we need to find more about this
topic.). So, PT100 profile might well be correct.
Add-ons
08/08/04
:
-
Brian has been hit by the same
puzzling virus: trying to find out what the PT100 actually measured.
-
He argues in the discussion
group, self-reflections omitted :)
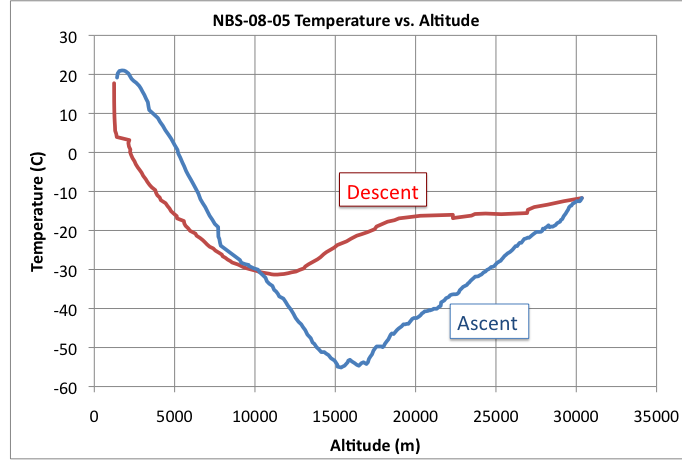
- Gypsy took detailed
pressure measurements the whole way up, and the
pressure at any given point in the atmosphere depends only on the mass
above it. If the temperature and gravity are assumed to be constant,
you can calculate the pressure using a constant scale height.
Of course, the reverse
is also true: given a pressure change, that
implies a certain scale height, *and thus a certain temperature*. Why
I didn't put those fact together quicker I have no idea, but as a
physicist it REALLY annoys me.
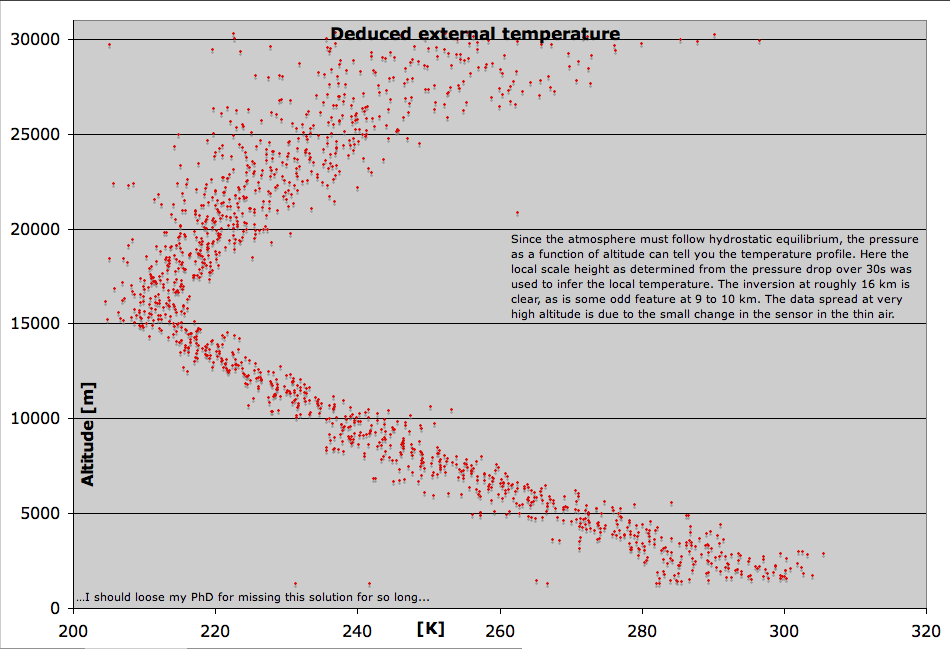
Anyway, take a look at
the graph I just uploaded, "External
Temperatures.png" (see below). I took my data and used it to
calculate a local
scale height based on the previous 30 seconds of data, and then used
that scale height and the theoretical value of "g" at that
altitude to
deduce the external temperature. It has a nice slope of 5.82 K/km
below the tropopause, and a more gently slope of 3.22 K/km above it.
Minimum temperature was -62 C, while the bottom-most layer of the
atmosphere was around 18 C (I know the ground and payload temperatures
exceeded that easily, but this is the bulk atmosphere). I've not done
this with your data yet, but certainly could (OK, probably will). when
I plot the external temperature on the same graphs with Gypsy's
internal temperatures, I see they start warming up right about the
time on descent that the ambient atmosphere is warmer than the chilled
interior, just as expected.
Add-ons 08/08/11
:
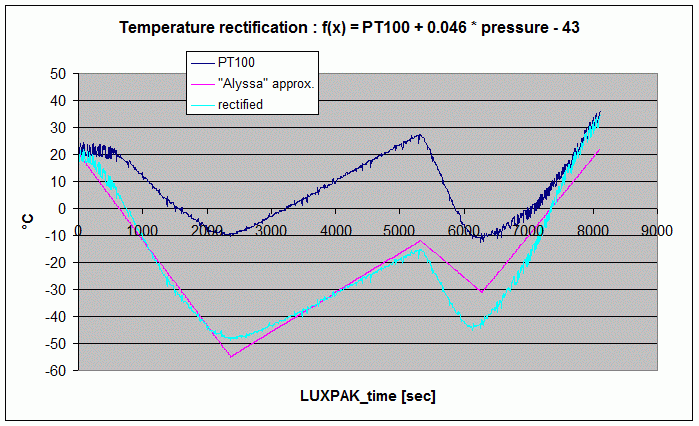
-
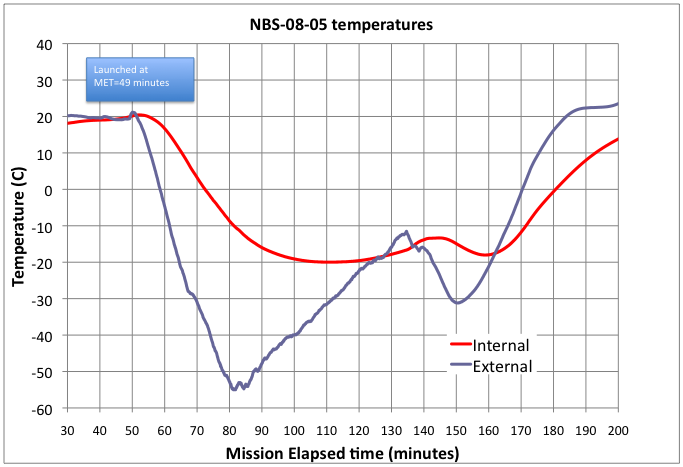
Brian Davis' theory that the
PT100 sensor is not cooled by the convection in the atmosphere because of
the extreme low air-density still seems appropriate. If we correct the PT100
data in linear combination with the pressure, then the values measured by
Alyssa's payload may easily be reconstructed as shown on the next picture.
-
Notes:
-
we use an apprximation
of Alyssa's data, because the values are not available.
-
we only consider the
relevant time of Alyssa's data
-
the rectification does
not affect LUXPAK's increase at the end, which is due to the heater
bug.
Add-ons 08/11/29
:
|
some links: (don't know how useful they are):
|
|
10.
back
scattered light intensity
-
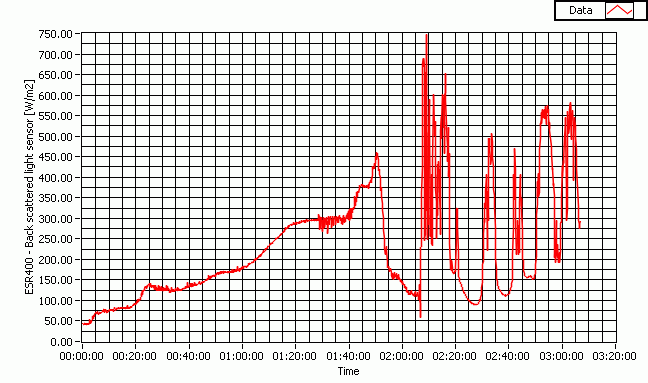
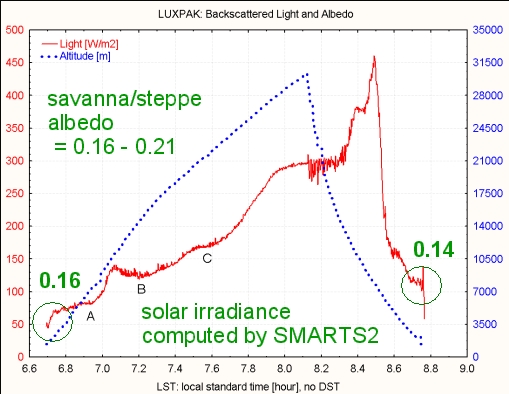
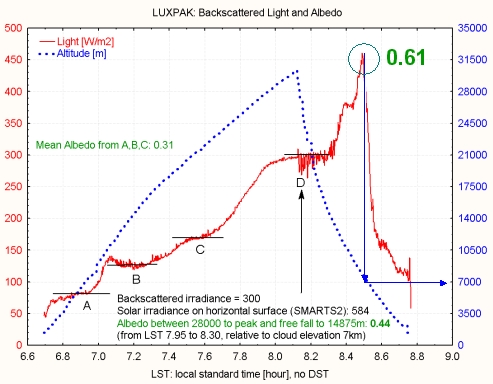
The back scattered light
intensity slowly grows during ascension, At MET 1h25' the almost freefall
starts and there are many small variations. Why the values grow afterwards,
peak at MET 1h50' is difficult to explain.
-
After the impact, some kind of
oscillations start, which certainly are related to clouds in the sky.
Add-ons 08/08/04
:
Add-ons 08/11/29
:
-
Francis has worked a lot in
order to find conclusions from the backscattered light data, especially to
determine the albedo. Using a special simulation program called
"SMARTS2", he was able to determine the local solar irradiance.
This was necessary, because we have not been able to get valuable data from
the launch area.
-
The results are impressive.
First the ground albedo could be yielded to 0.16 and 0.14 respectively.
Second the albedo just over the clouds was calculated to 0.61, which is very
realistic, if we consider that there were many stratocumuli clouds located
between 2000 and 7000m.
|
|
|
11.
RCX
supply voltage
-
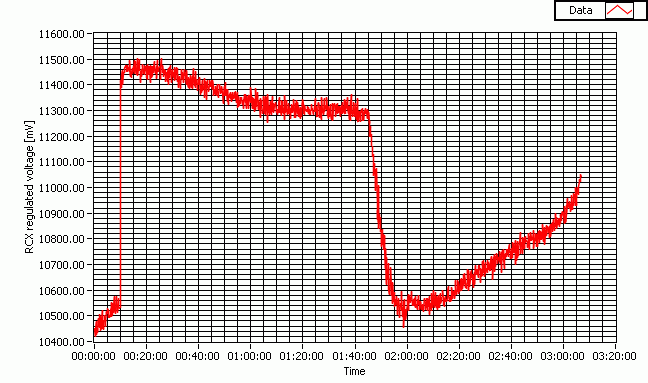
The supply voltage drops by 1V
during the first 10 minutes heater time. However, due to a slight increase
of the battery temperature, the voltage grows proportionnally.
-
During the non heated time. The
voltage slowly drops by 0.2V, with a stabilzation at MET 1h00 (battery
temperature local minimum).
-
After MET 1h45' the voltage
drops once again, but then slowly grows due to the temperature increase in
the batteries.
|
|
|
12.
system
time
Add-ons 08/08/08
:
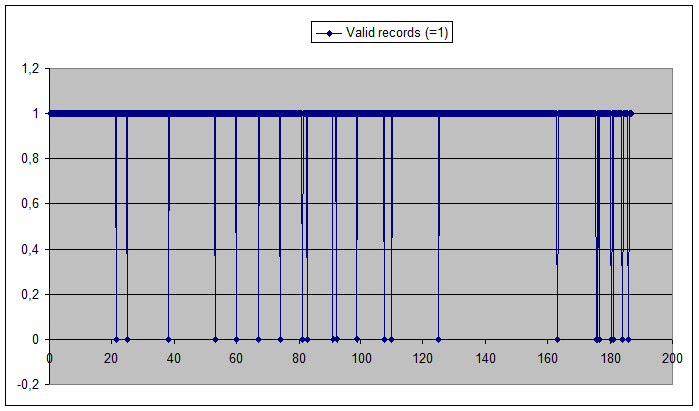
|
|
2008/08/13
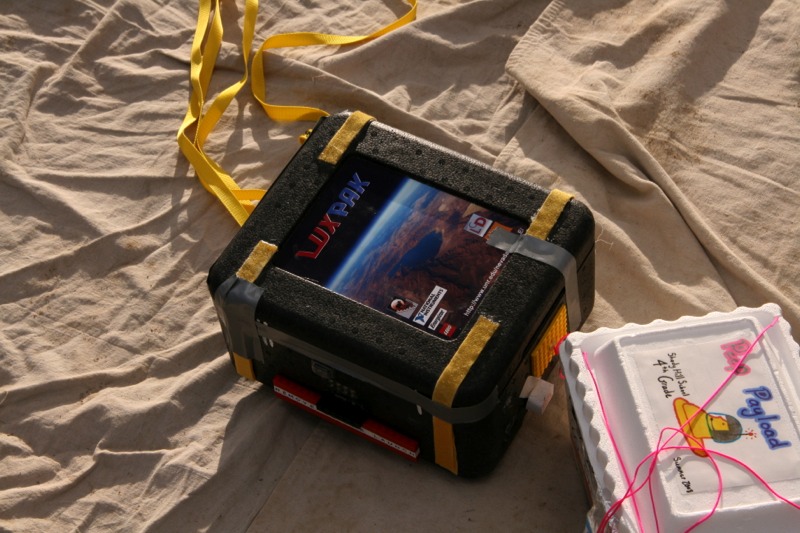
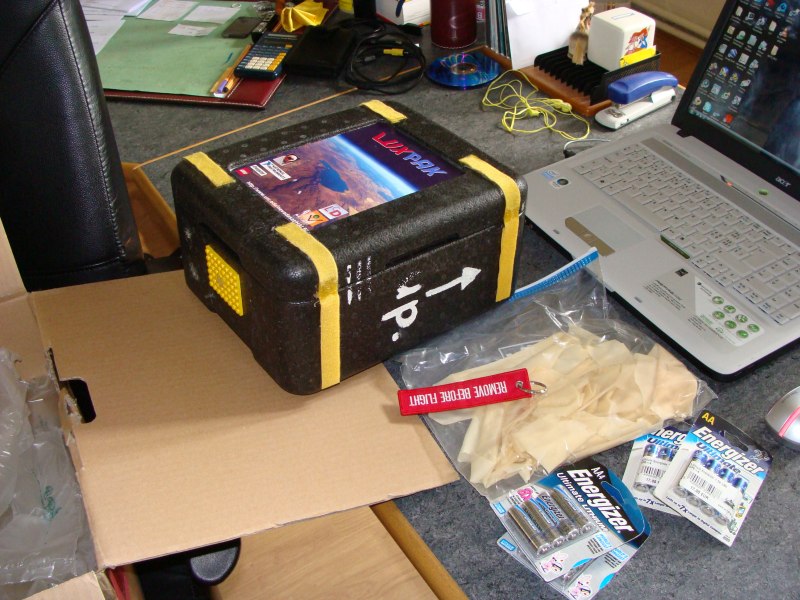
- LUXPAK arrived back home safely. Note the
balloon fragments and the battery sets that Eric added to the packet. Thanks
! LUXPAK looks as if it never went off. No scratches or damages what so
ever. We hardly can believe it did that trip!
|
|
2008/11/29
- We have had a presentation of the HALE project
yesterday with a very interested audience.

|
French announcement:
Le Konvikt et le Lycée Classique de Diekirch
participaient au concours H.A.L.E lancé en avril 2008 par l’Université de
Nevada-Reno pour développer un module de mesures scientifiques ; ce module
devrait être emmené par un ballon jusque vers la stratosphère (env. 30 km).
Seulement 7 équipes par le monde furent acceptées, dont celle du Konvikt/LCD
avec son projet LUXPAK. L’entreprise fut lancée pour commémorer le 10ème
anniversaire du développement robotique Mindstorm/RCX de Lego, et LUXPAK
utilise à plein les capacités du microordinateur RCX. Claude Baumann et
Francis Massen présentent cette aventure qu’ils ont réalisée avec leurs étudiants
et qui s’est terminée avec le lancement et la récupération réussies de
LUXPAK dans le désert du Nevada.
|
|


