
|
|
|
created 27/02/2009 last update 15/03/2009 (added link to Sivan Toledo's study of the timing) |
||||||||
|
prior work: Brian
Davis' excellent response test for an almost constant sound pressure.
|
||||||||
This page investigates some of the characteristics
of the LEGO™ NXT sound sensor.
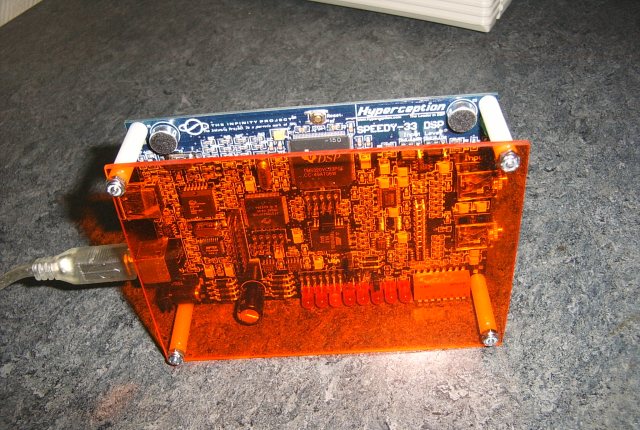
We wanted to explore how the sensor reacts in function of the signal frequency. Therefore we programmed the NI DSP module Speedy-33 as a pure sound generator with variable frequency and amplitude. The module was connected to an audio amplifier. The sound intensity was measured with the same DSP module (Fig. 1) that had been placed at about 20cm from the loudspeaker. The sound level also was captured by the NXT sound sensor. In fact, we were using two NXT sound sensors, the first being configured in dBA mode and the second in dB mode. The DSP returned the RMS (Root mean square value) that is converted into dBV, where the reference is not 1V, but 3.3V. The reason for this bizarre referencing is that the RMS-values can easily be divided by the maximal measurable signal strength of the DSP, which is 215-1=32767, the maximal allowed amplitude for a 16bit ADC. The conversion formula then is:
Fig. 1 : The NI Speedy-33 DSP module allows interesting experiments. |
||||||||
|
We may assume that the NI DSP is able to measure the sound pressure in a linear way over a wide range and we estimate that 0dBV roughly correspond to 100dB SPL (not being able to calibrate the DSP module yet). (Fig. 2) shows the embedded LabVIEW program for the DSP module.
Fig. 2 : The DSP module generates the sound signal and also measures the signal strength. |
||||||||
|
Both LEGO™ NXT sound sensors were placed at the same distance from the speaker. A very simple LabVIEW NXT toolkit was run in debugging mode, in order to display the values on the PC screen and keep the NXT alive (Fig. 3). The frequency and the signal amplitude were gradually changed and the sensor readings were noted manually and entered into an Excel-file and also into a LabVIEW 3D-graph program (that we do not reproduce here). (Fig. 4 and 5) show the different graphs in 3D for the frequencies 100..1000Hz.
Fig. 3 : A simple NXT program on the LabVIEW tookit. |
||||||||
|
Fig. 4 : The NXT dBA-values in function of the frequency (100..1000Hz) and the signal strength.
Fig. 5 : The NXT dB-values in function of the frequency (100..1000Hz) and the signal strength. The figures show that the NXT sound sensor has bad response in dBA-mode for frequencies below 200Hz. The sensor is more sensitive in dB-mode and rapidly clips, in the presence of medium strength signals. In the case of frequencies below 400Hz, the values even decrease with growing signal intensity. The following graphs (Fig. 6 & 7) add the test-values for frequencies greater than 1kHz. |
||||||||
|
Fig. 6 : All the NXT dBA test values in function of dBV and parameterized to the sound frequency.
Fig. 7 : All the NXT dB test values in function of dBV and parameterized to the sound frequency. |
||||||||
|
From the data we can interpolate the values that the DSP should read, for a constant NXT value dBA=20 or dB=20 (something between talking and loud laughing). The corresponding graph (Fig. 8) should represent our best estimate for the sensor sensitivity. On the graph we add the 60 Phons human sensitivity curve as a reference. (Remember that the entire graph could also be transposed into dB SPL values by adding 100 to the dBV reading.). The extreme deviating value at 3kHz is intriguing. We repeated the experiment to be sure this is not a mistake. In NXT-dB mode the sensitivity curve looks like a Chebychev filter response curve. (Fig. 9) may be considered as the inverse function of the previkous. The graphs draws the NXT sound sensor response for different frequencies, while the sound pressure level has been held constant. We also reproduced the circuit (dBA-mode) in CircuitMaker Student edition, run the simulation and could NOT confirm any bad result around 3kHz as can be seen on (Fig. 10). If we draw the NXT-dBA curve of (Fig. 9) with logarithmic scale on the x-axis (Fig. 11), we get a comparable graph, but the maximum is located one magnitude earlier. This is puzzling.
Fig. 8 : NXT sensor sensitivity at medium loudness.
Fig. 9 : This graph is drawn on the base of constant sound pressure level.
Fig. 10 : CircuitMaker output for the response of the NXT sound sensor amplifier stages (dBA-mode).
Fig. 11 : The dBA curve from (Fig. 9) is drawn on a logarithmic scale. We did not trust our first measurements, so we tried another time with a different sensor. This time the response (Fig. 12) around 3kHz is even more intriguing.
Fig. 12 : A second attempt shows unreliable response around 3kHz. May be, we do something wrong!? |
||||||||
|
We also had a look into the NXT sound sensor schematics that can be extracted from the LEGO HDK (Hardware Developer Kit). The developers of the NXT sound sensor use the DIGIAI0 and DIGIAI1 to change the gain characteristics of the amplifier. We measured the voltages for both configurations and noted:
From the schematics we also learn that the sound peak detector has a charging time constant that is defined by two 220k resistors, which may be considered in parallel, and a 470nF capacitor: Tc=R*C=220k/2*470nF=0.05s. The discharging of the capacitor is effectuated over the opamp resistors and may be approximated with Td=(220k/2+600k/2)*470nF=0.2s. These delay predictions are confirmed by Sivan Toledo's clapping experiments. This slow response does not allow any room-echo measurements with one single NXT sound sensor. If we consider the spacing between a sensor and a wall as 3m, the echo appears after 3/c=3/343=9ms, where c is the aerial sound velocity at ambient temperature. (Note that Sivan Toledo ignores echoes in the explanation of the -wav diagram. In anachoic chambers clapping patterns are much shorter. Also he doesn't take into account the capacitor charging and discharging time constant. Signals produced by the NXT sound sensor are not memoryless.) However two NXT sound sensors may well form an interaural level difference sensor. Here a few links to such interesting work:
External link:
The NXT analog sensor sampling rate is too slow to allow that two NXT sound sensors may be combined as a precedence effect sensor. If we suppose the spacing between two sound sensors to be 20cm for example, the maximum delay between the impact of the sound wave on the microphones is 0.2/343=0.5ms, which is one magnitude smaller than the period of the NXT sampling. Nevertheless one could easily build a digital circuit, either based on traditional gating logic or on microcontroller, that could measure the time delay and that would use the NXT sound sensors.
|
||||||||
Conclusions:
|
||||||||
| HOME |
 and the converted values all are negative.